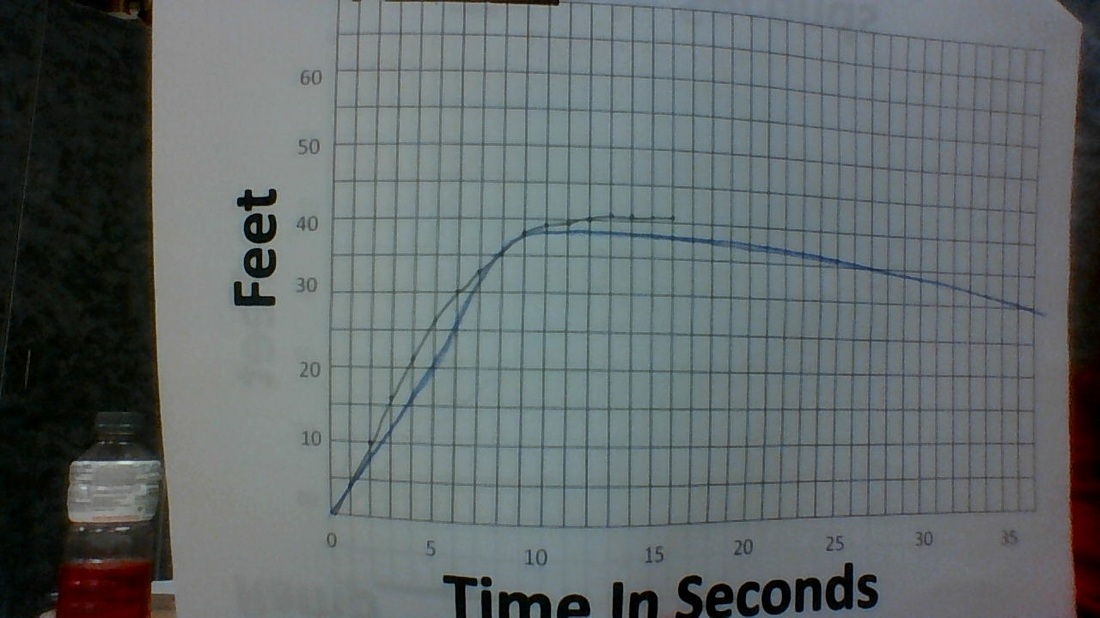
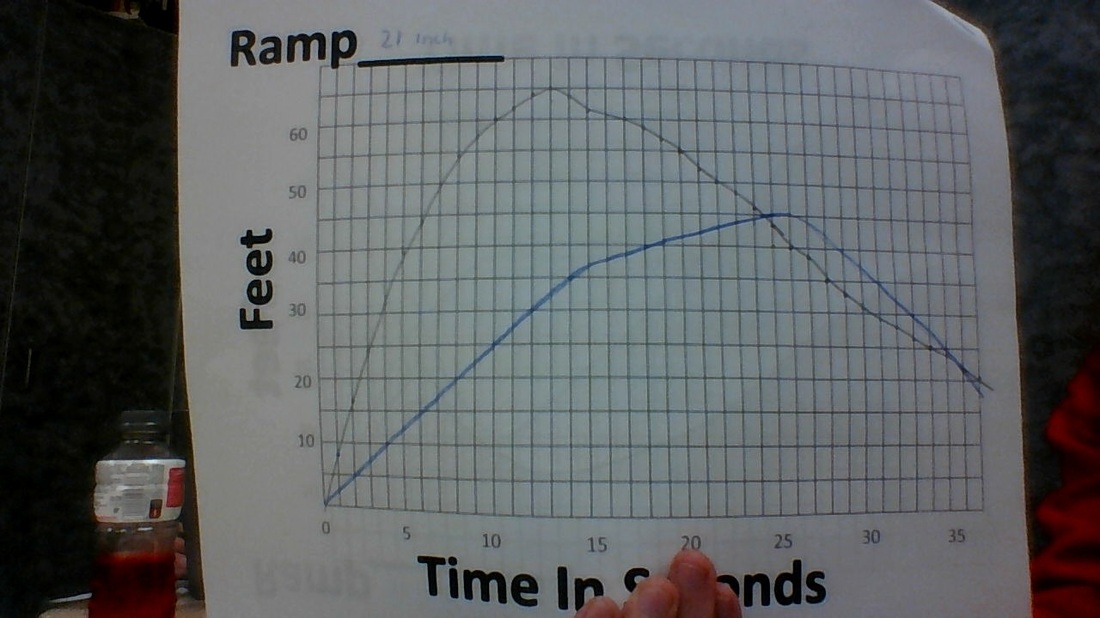
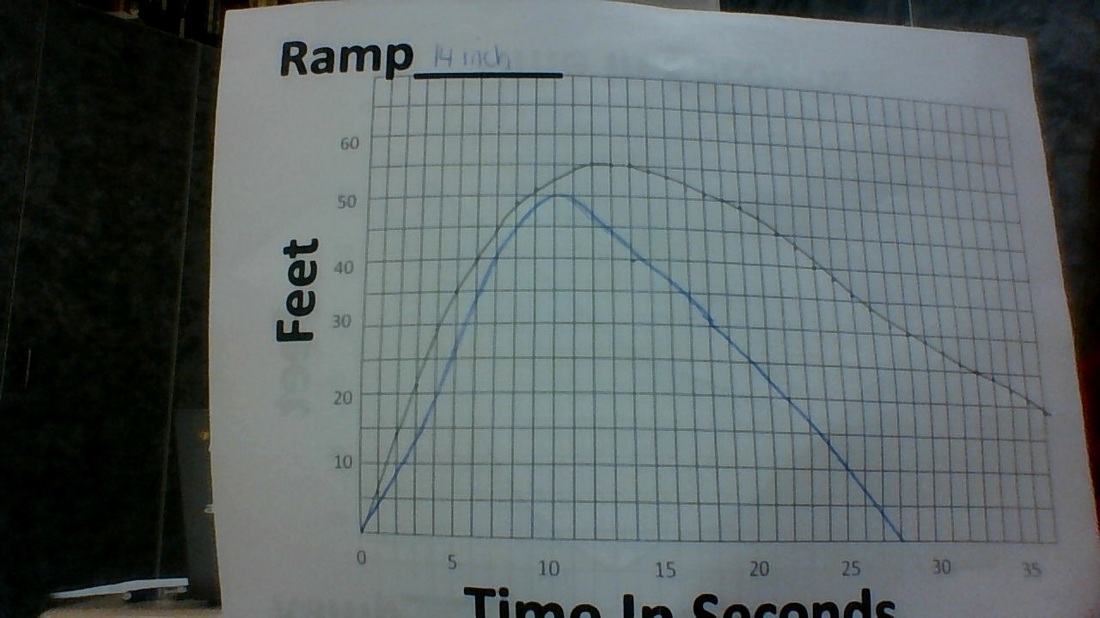
My prediction on the 21 inch ramp (middle picture) was completely off. It was the first one we did so I just kind of drew a line to be completely honest. The 14 inch ramp (picture on right) was pretty accurate until the decreasing slope. I thought it decreased faster than it really did. And lastly the picture on the left is the 7 inch ramp, I was pretty good on that one because I used the knowledge of the two before and it worked out!
The domain of the first picture, the 7 inch ramp, is 0-35 and the range is 0-41.
The domain of the second, 21 inch, 0-35 and the range is 0-65.
Lastly the 14 inch ramp had a domain of 0-35 and a range of 0-55.
All of these graphs are similar because they all stop increasing around the same numbers and they all just go up and then go back down, there's nothing else. As the ramp height goes down though, the graphs get slower, the climb and descend slower.
The graphs always rise faster as soon as they leave the ramp because they have the most speed then and decrease the fastest when they get about half way back through the line when they pick up momentum.
 RSS Feed
